We invite you to explore selected data visualisation tools, provided free of charge by some international organisations.
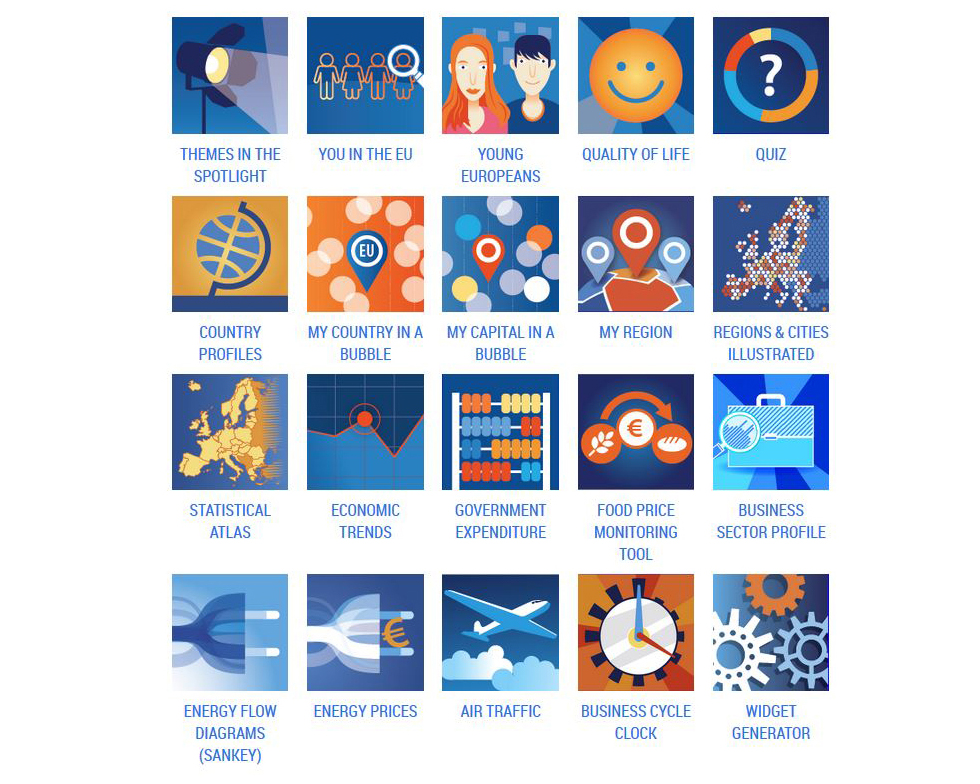
Eurostat (Statistical Office of the European Union) provides a wide range of visualisation tools based on data collections stored in the database. You may find among them Statistical Atlas or Regions & Cities Illustrated which allow comparison of EU regions using maps, charts and tables, as well as Economic Trends – tool that clearly presents the main economic indicators. In turn, Country Profiles allows you to easily compare EU countries with each other or with the EU as a whole in many areas.
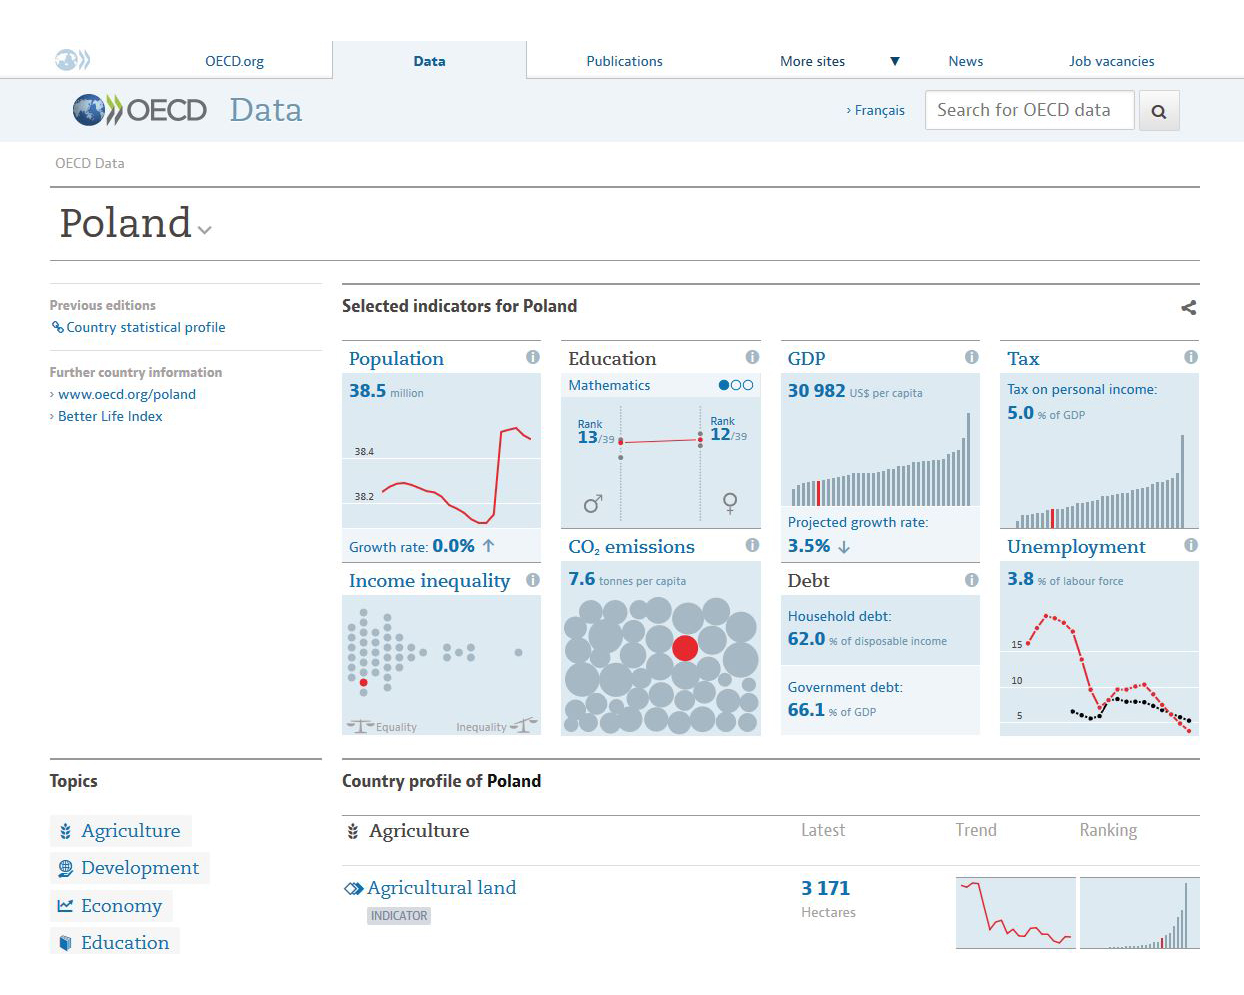
OECD (Organisation for Economic Co-operation and Development) provides access to all organisation’s databases via website, enables searching and comparing data along with its presentation on charts. It makes access to statistical resources easier by redirecting to OECD.Stat Extracts databases and interactive visualisation tools Data Lab – gallery of tables and charts that can be modified according to your needs. The portal contains links to publications, explanations and detailed statistics in „More sites” tab.
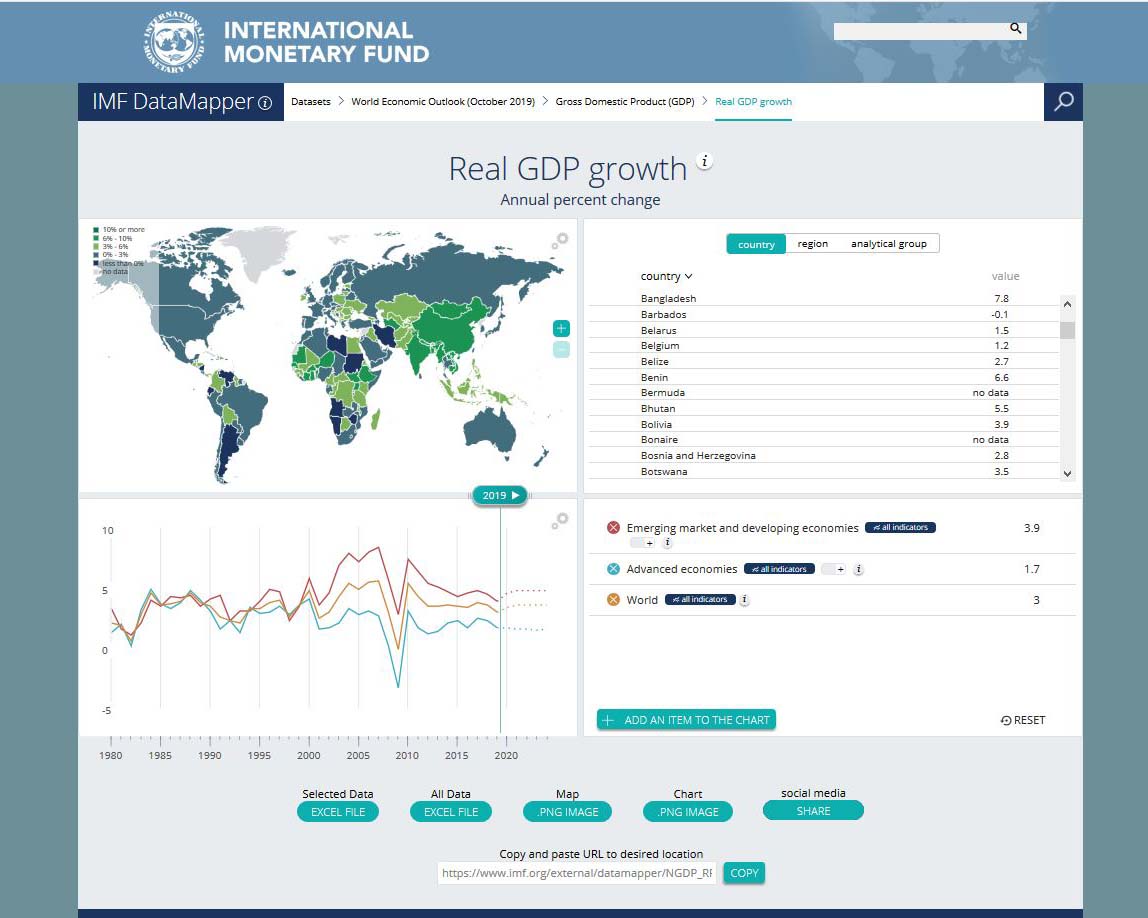
Interactive tool created by IMF (International Monetary Fund) to visualise economic and financial data, including IMF loans and exchange rates, in long time series (since 1980). The tool provides intuitive access to key statistics, i.a. enables data comparison among countries, world regions or analytical areas. The results are displayed in the form of interactive maps and charts, which can be downloaded or shared.
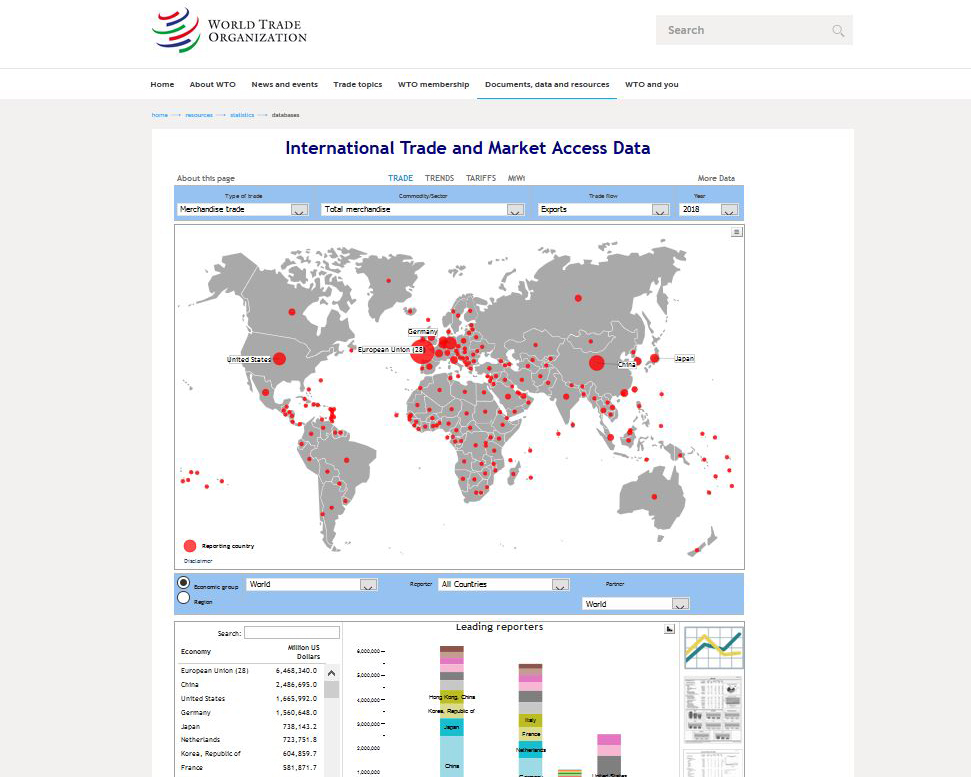
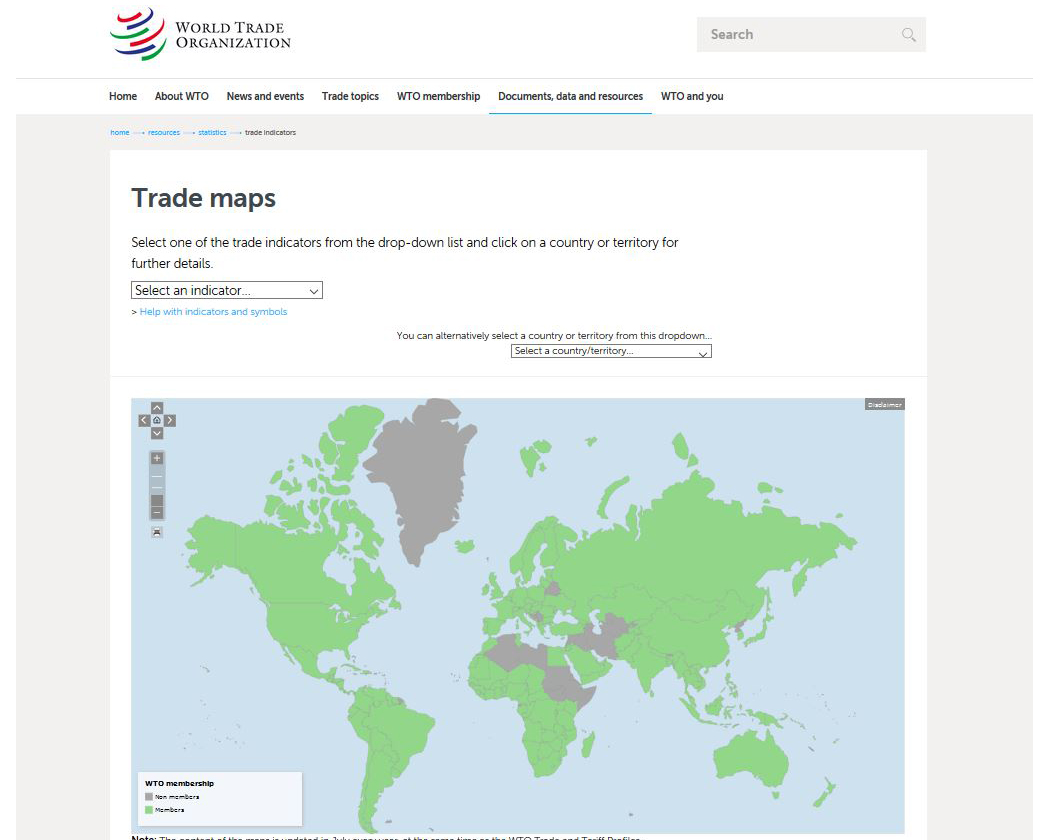
WTO (World Trade Organisation) provides interactive tools for data visualisation based on information stored in database systems i.a.:
- Trade Maps – an interactive map enabling comparison of international trade indicators (including share of trade in GDP, exports and imports of goods or commercial services) between countries of the world.
- International Trade and Market Access Data interactive tool – a tool for creating visualisations illustrating the development of exports and imports, sales trends and tariffs depending on the type of trade, sector or product. It allows comparisons between countries, regions and economic groups in selected categories using maps, charts and rankings, which can be downloaded both in the form of visualisations and as source data. The portal contains links to publications, documents, detailed statistics and information on international trade (some available after registration).